|
PlottI
|
|
PlottI
|
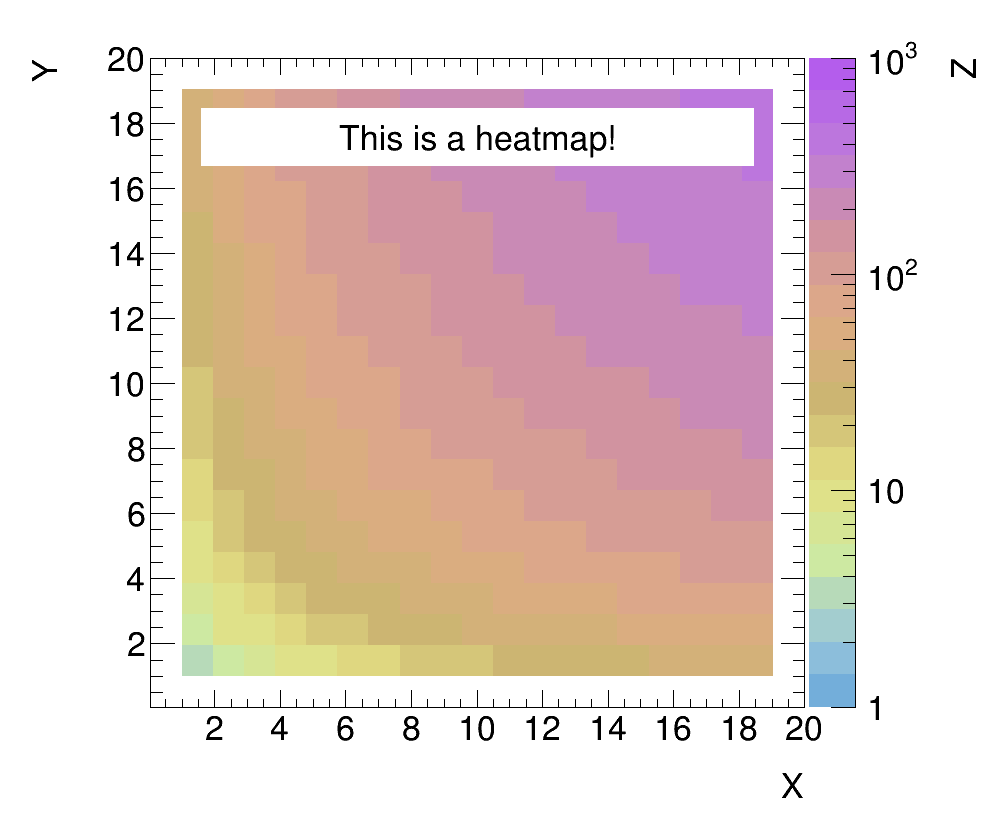
Class for plotting a single TH2 (heatmap) and one corresponding legend. More...
#include <PlotDerived.h>

Class for plotting a single TH2 (heatmap) and one corresponding legend.
Default measures:
dimensions: width = 1000, height = 850margins: left = 0.15, right = 0.2, top = 0.07, bottom = 0.15offsets: x-Axis = 1.3, y-Axis = 1.5, z-Axis = 1.5 Public Member Functions | |
| HeatMapPlot (TObjArray *plotArray, TString xTitle, TString yTitle, TString zTitle="count") | |
| Constructor. | |
| HeatMapPlot (TH2 *map, TLegend *l, TString xTitle, TString yTitle, TString zTitle="count") | |
| Constructor. | |
| void | Draw (TString outname) |
| void | SetProperties (TH2 *map, std::string title="") |
| void | SetCanvasOffsets (Float_t xOffset, Float_t yOffset, Float_t zOffset) |
| void | SetLog (Bool_t xLog=kFALSE, Bool_t yLog=kTRUE, Bool_t zLog=kFALSE) |
| virtual void | SetRanges (Float_t xLow, Float_t xUp, Float_t yLow, Float_t yUp, Float_t zLow, Float_t zUp) |
 Public Member Functions inherited from Plot Public Member Functions inherited from Plot | |
| Plot (TString xTitle, TString yTitle) | |
| Abstract constructor. | |
| void | Draw () |
| Abstract template for function. | |
| void | SetProperties (TObject *obj, Int_t index) |
| void | SetCanvasDimensions (Float_t cWidth, Float_t cHeight) |
| void | SetCanvasMargins (Float_t rMargin, Float_t lMargin, Float_t tMargin, Float_t bMargin) |
| void | SetCanvasOffsets (Float_t xOffset, Float_t yOffset) |
| void | SetLog (Bool_t xLog=kFALSE, Bool_t yLog=kTRUE) |
| void | SetRanges (Float_t xLow, Float_t xUp, Float_t yLow, Float_t yUp) |
| void | SetOffset (Int_t off) |
| void | SetMode (Mode m) |
| void | SetStyle (std::vector< Color_t > col, std::vector< Style_t > mark, std::vector< Size_t > siz={}, std::vector< Style_t > lstyl={}, std::vector< Size_t > lwid={}) |
| void | ToggleStyle () |
| Toggle wether style arrays are used. Note that SetStyles will automatically set this to on. | |
| void | SetPalette (Int_t pal, Bool_t invert=kFALSE) |
| void | SetPalette (ColorGradient &pal, Bool_t invert=kFALSE) |
| void | SetOptions (TString opt) |
| void | SetOptions (std::vector< std::string > optns) |
| virtual void | SetOptions (std::string optns, std::string postns, Int_t off=0) |
| void | SetOption (std::string opt, Int_t pos) |
Additional Inherited Members | |
| Public Types inherited from Plot | |
| enum | Mode : unsigned int { Presentation, Thesis, Auto } |
| Enumerator for choice of Mode, determining font size and style. More... | |
| Static Public Member Functions inherited from Plot | |
| template<class PO > | |
| static void | SetLineProperties (PO *pobj, Color_t color, Style_t lstyle, Size_t lwid=2.) |
| template<class PO > | |
| static void | SetMarkerProperties (PO *pobj, Color_t color, Style_t mstyle, Size_t msize=3.) |
| template<class PO > | |
| static void | SetPlottjectProperties (PO *pobj, Color_t color, Style_t mstyle, Size_t msize=3., Style_t lstyle=1, Size_t lwid=2., std::string title="") |
| Protected Member Functions inherited from Plot | |
| void | EnsureAxes (TObject *first, std::string arrayName="") |
| template<class AO > | |
| void | SetCanvasStyle (AO *first, Float_t xOff, Float_t yOff) |
| template<class AO > | |
| void | SetPadStyle (AO *first, TString xTitle, TString yTitle, Float_t xUp, Float_t xLow, Float_t yUp, Float_t yLow) |
| template<class AO > | |
| void | SetRangesAuto (AO *first) |
| template<class AO > | |
| void | SuppressXaxis (AO *first) |
| template<class AO > | |
| void | SuppressYaxis (AO *first) |
| void | SetUpStyle (TObject *first, TString xTitle, TString yTitle, Float_t xUp, Float_t xLow, Float_t yUp, Float_t yLow, Float_t xOff, Float_t yOff) |
| void | SetUpPad (TPad *pad, Bool_t xLog, Bool_t yLog) |
| void | DrawArray (TObjArray *array, Int_t off=0, Int_t offOpt=0) |
| Protected Attributes inherited from Plot | |
| TPad * | mainPad {nullptr} |
| Main pad. | |
| TCanvas * | canvas {nullptr} |
| Main canvas. | |
| std::vector< std::string > | options |
| Drawing options. | |
| TString | titleX |
| Title of X-axis. | |
| TString | titleY |
| Title of Y-axis. | |
| Float_t | width {0} |
| Width of canvas. | |
| Float_t | height {0} |
| Height of canvas. | |
| Float_t | offsetX {0} |
| Offset of X title. | |
| Float_t | offsetY {0} |
| Offset of Y title. | |
| Float_t | rightMargin {0} |
| Right margin of (main) pad. | |
| Float_t | leftMargin {0} |
| Left margin of (main) pad. | |
| Float_t | topMargin {0} |
| Top margin of (main) pad. | |
| Float_t | bottomMargin {0} |
| Bottom margin of (main) pad. | |
| Bool_t | logX {kFALSE} |
| Should X-axis be logarithmic? | |
| Bool_t | logY {kFALSE} |
| Should Y-axis be logarithmic? | |
| Float_t | yRangeLow {0} |
| Lower Y-axis range. | |
| Float_t | yRangeUp {100} |
| Upper Y-axis range. | |
| Float_t | xRangeLow {0} |
| Lower X-axis range. | |
| Float_t | xRangeUp {100} |
| Upper X-axis range. | |
| Bool_t | ranges {kFALSE} |
| Were ranges set manually? | |
| Bool_t | broken {kFALSE} |
| Did any fatal error occur? | |
| Static Protected Attributes inherited from Plot | |
| static Int_t | palette {109} |
| Color Palette. | |
| static Bool_t | inversion {kFALSE} |
| Should palette be inverted? | |
| static Bool_t | inverted {kFALSE} |
| Is palette currently inverted? | |
| static std::vector< Int_t > | palColors |
| Color vector of personalised palette. | |
| static std::vector< Color_t > | colors |
| Object colors. | |
| static std::vector< Style_t > | markers |
| Object marker style. | |
| static std::vector< Style_t > | lstyles |
| Object line style. | |
| static std::vector< Size_t > | sizes |
| Object marker size. | |
| static std::vector< Size_t > | lwidths |
| Object line width. | |
| static Bool_t | styles {kFALSE} |
| Were styles set manually? | |
| static Style_t | font {43} |
| Font style. | |
| static Style_t | label {28} |
| Label size. | |
| static Int_t | mOffset {0} |
| Offset for style array index. | |
| void HeatMapPlot::Draw | ( | TString | outname | ) |
Main function for Drawing
| void HeatMapPlot::SetCanvasOffsets | ( | Float_t | xOffset, |
| Float_t | yOffset, | ||
| Float_t | zOffset | ||
| ) |
Set the Title Offsets
| void HeatMapPlot::SetLog | ( | Bool_t | xLog = kFALSE, |
| Bool_t | yLog = kTRUE, |
||
| Bool_t | zLog = kFALSE |
||
| ) |
Sets wether X and/or Y axis will be displayed logarithmically
| void HeatMapPlot::SetProperties | ( | TH2 * | map, |
| std::string | title = "" |
||
| ) |
Manages internal setting of properties for TH2 heatmap plots
|
virtual |
Set the Ranges
 1.8.5
1.8.5

