|
PlottI
|
|
PlottI
|
Base class for all plotting functionality. More...
#include <PlotBase.h>
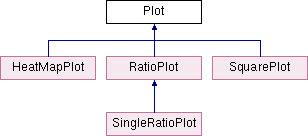
Base class for all plotting functionality.
This class contains all functions necessary for basic plotting functionality. This way very little additional programming is necessary for derived classes. This class is meant to be purely a base for implementing the derived classes and should not be instanced itself.
Public Types | |
| enum | Mode : unsigned int { Presentation, Thesis, Auto } |
| Enumerator for choice of Mode, determining font size and style. More... | |
Public Member Functions | |
| Plot (TString xTitle, TString yTitle) | |
| Abstract constructor. | |
| void | Draw () |
| Abstract template for function. | |
| void | SetProperties (TObject *obj, Int_t index) |
| void | SetCanvasDimensions (Float_t cWidth, Float_t cHeight) |
| void | SetCanvasMargins (Float_t rMargin, Float_t lMargin, Float_t tMargin, Float_t bMargin) |
| void | SetCanvasOffsets (Float_t xOffset, Float_t yOffset) |
| void | SetLog (Bool_t xLog=kFALSE, Bool_t yLog=kTRUE) |
| void | SetRanges (Float_t xLow, Float_t xUp, Float_t yLow, Float_t yUp) |
| void | SetOffset (Int_t off) |
| void | SetMode (Mode m) |
| void | SetStyle (std::vector< Color_t > col, std::vector< Style_t > mark, std::vector< Size_t > siz={}, std::vector< Style_t > lstyl={}, std::vector< Size_t > lwid={}) |
| void | ToggleStyle () |
| Toggle wether style arrays are used. Note that SetStyles will automatically set this to on. | |
| void | SetPalette (Int_t pal, Bool_t invert=kFALSE) |
| void | SetPalette (ColorGradient &pal, Bool_t invert=kFALSE) |
| void | SetOptions (TString opt) |
| void | SetOptions (std::vector< std::string > optns) |
| virtual void | SetOptions (std::string optns, std::string postns, Int_t off=0) |
| void | SetOption (std::string opt, Int_t pos) |
Static Public Member Functions | |
| template<class PO > | |
| static void | SetLineProperties (PO *pobj, Color_t color, Style_t lstyle, Size_t lwid=2.) |
| template<class PO > | |
| static void | SetMarkerProperties (PO *pobj, Color_t color, Style_t mstyle, Size_t msize=3.) |
| template<class PO > | |
| static void | SetPlottjectProperties (PO *pobj, Color_t color, Style_t mstyle, Size_t msize=3., Style_t lstyle=1, Size_t lwid=2., std::string title="") |
Protected Member Functions | |
| void | EnsureAxes (TObject *first, std::string arrayName="") |
| template<class AO > | |
| void | SetCanvasStyle (AO *first, Float_t xOff, Float_t yOff) |
| template<class AO > | |
| void | SetPadStyle (AO *first, TString xTitle, TString yTitle, Float_t xUp, Float_t xLow, Float_t yUp, Float_t yLow) |
| template<class AO > | |
| void | SetRangesAuto (AO *first) |
| template<class AO > | |
| void | SuppressXaxis (AO *first) |
| template<class AO > | |
| void | SuppressYaxis (AO *first) |
| void | SetUpStyle (TObject *first, TString xTitle, TString yTitle, Float_t xUp, Float_t xLow, Float_t yUp, Float_t yLow, Float_t xOff, Float_t yOff) |
| void | SetUpPad (TPad *pad, Bool_t xLog, Bool_t yLog) |
| void | DrawArray (TObjArray *array, Int_t off=0, Int_t offOpt=0) |
Protected Attributes | |
| TPad * | mainPad {nullptr} |
| Main pad. | |
| TCanvas * | canvas {nullptr} |
| Main canvas. | |
| std::vector< std::string > | options |
| Drawing options. | |
| TString | titleX |
| Title of X-axis. | |
| TString | titleY |
| Title of Y-axis. | |
| Float_t | width {0} |
| Width of canvas. | |
| Float_t | height {0} |
| Height of canvas. | |
| Float_t | offsetX {0} |
| Offset of X title. | |
| Float_t | offsetY {0} |
| Offset of Y title. | |
| Float_t | rightMargin {0} |
| Right margin of (main) pad. | |
| Float_t | leftMargin {0} |
| Left margin of (main) pad. | |
| Float_t | topMargin {0} |
| Top margin of (main) pad. | |
| Float_t | bottomMargin {0} |
| Bottom margin of (main) pad. | |
| Bool_t | logX {kFALSE} |
| Should X-axis be logarithmic? | |
| Bool_t | logY {kFALSE} |
| Should Y-axis be logarithmic? | |
| Float_t | yRangeLow {0} |
| Lower Y-axis range. | |
| Float_t | yRangeUp {100} |
| Upper Y-axis range. | |
| Float_t | xRangeLow {0} |
| Lower X-axis range. | |
| Float_t | xRangeUp {100} |
| Upper X-axis range. | |
| Bool_t | ranges {kFALSE} |
| Were ranges set manually? | |
| Bool_t | broken {kFALSE} |
| Did any fatal error occur? | |
Static Protected Attributes | |
| static Int_t | palette {109} |
| Color Palette. | |
| static Bool_t | inversion {kFALSE} |
| Should palette be inverted? | |
| static Bool_t | inverted {kFALSE} |
| Is palette currently inverted? | |
| static std::vector< Int_t > | palColors |
| Color vector of personalised palette. | |
| static std::vector< Color_t > | colors |
| Object colors. | |
| static std::vector< Style_t > | markers |
| Object marker style. | |
| static std::vector< Style_t > | lstyles |
| Object line style. | |
| static std::vector< Size_t > | sizes |
| Object marker size. | |
| static std::vector< Size_t > | lwidths |
| Object line width. | |
| static Bool_t | styles {kFALSE} |
| Were styles set manually? | |
| static Style_t | font {43} |
| Font style. | |
| static Style_t | label {28} |
| Label size. | |
| static Int_t | mOffset {0} |
| Offset for style array index. | |
| enum Plot::Mode : unsigned int |
|
protected |
Draws a single TObjArray in the chosen Pad
|
protected |
Ensure that first object in array to be plotted has well defined axes
| void Plot::SetCanvasDimensions | ( | Float_t | cWidth, |
| Float_t | cHeight | ||
| ) |
Set Dimensions of the Canvas
| void Plot::SetCanvasMargins | ( | Float_t | rMargin, |
| Float_t | lMargin, | ||
| Float_t | tMargin, | ||
| Float_t | bMargin | ||
| ) |
Set the Margins of the Canvas
| void Plot::SetCanvasOffsets | ( | Float_t | xOffset, |
| Float_t | yOffset | ||
| ) |
Set the Title Offsets
|
protected |
Set general style features of the Canvas and Pads
|
static |
Set style properties of lines
| void Plot::SetLog | ( | Bool_t | xLog = kFALSE, |
| Bool_t | yLog = kTRUE |
||
| ) |
Sets wether X and/or Y axis will be displayed logarithmically
|
static |
Set style properties of markers
| void Plot::SetMode | ( | Mode | m | ) |
Set the mode of the program, based on what the plots will be used for
| void Plot::SetOffset | ( | Int_t | off | ) |
Sets the offset of the style properties markers
| void Plot::SetOption | ( | std::string | opt, |
| Int_t | pos | ||
| ) |
Set the plot option for a specific plottject mind that any legend or pave object is also included in the options
| void Plot::SetOptions | ( | TString | opt | ) |
Set one plot option for all plottjects
| void Plot::SetOptions | ( | std::vector< std::string > | optns | ) |
Set the plot options for the plottjects, mind that any legend or pave object must also be included
|
virtual |
Set the plot options optns for a few specific plottjects at positions postns, off will be an offset added to all individual positions; mind that any legend or pave object is also included in the options
|
protected |
Set style aspects of the pads
| void Plot::SetPalette | ( | Int_t | pal, |
| Bool_t | invert = kFALSE |
||
| ) |
Set the palette that will be used for the plots
| void Plot::SetPalette | ( | ColorGradient & | pal, |
| Bool_t | invert = kFALSE |
||
| ) |
Set the palette that will be used for the plots
|
static |
Set style properties of plottable objects
| void Plot::SetProperties | ( | TObject * | obj, |
| Int_t | index | ||
| ) |
Manages internal setting of properties for all plottable objects
| void Plot::SetRanges | ( | Float_t | xLow, |
| Float_t | xUp, | ||
| Float_t | yLow, | ||
| Float_t | yUp | ||
| ) |
Set the Ranges
|
protected |
Automatically determine good ranges
| void Plot::SetStyle | ( | std::vector< Color_t > | col, |
| std::vector< Style_t > | mark, | ||
| std::vector< Size_t > | siz = {}, |
||
| std::vector< Style_t > | lstyl = {}, |
||
| std::vector< Size_t > | lwid = {} |
||
| ) |
Set style arrays for the histograms and functions
|
protected |
Sets up a Pad for Plotting
|
protected |
Set Style aspects of pad and canvas
|
protected |
Supress x axis for Plots with multiple pads
|
protected |
Supress y axis for Plots with multiple pads
 1.8.5
1.8.5

